Background
Monitoring service health is beyond the standard system monitoring which only focuses on monitoring availability, utilization, and other basic metrics most system administrators attend to on their day-to-day work. Service Health Monitoring involves managing the overall health of a service or an application and all of its underlying infrastructure components.
...
Service health is a combination of Availability, Performance, Alerts, and Analytics. It indicates whether a service is healthy or not. But what does healthy really mean in the context of service health monitoring? Can a service be considered healthy if it is available yet the performance is bad? How about if the performance is good, does that equate to a service being healthy? Or maybe, alerts are flooding in but the service is available and performing well, what does that indicate? The truth is—not one factor indicates whether a service is healthy or not. When monitoring service health, you need to look at the perspective from a 360° view.
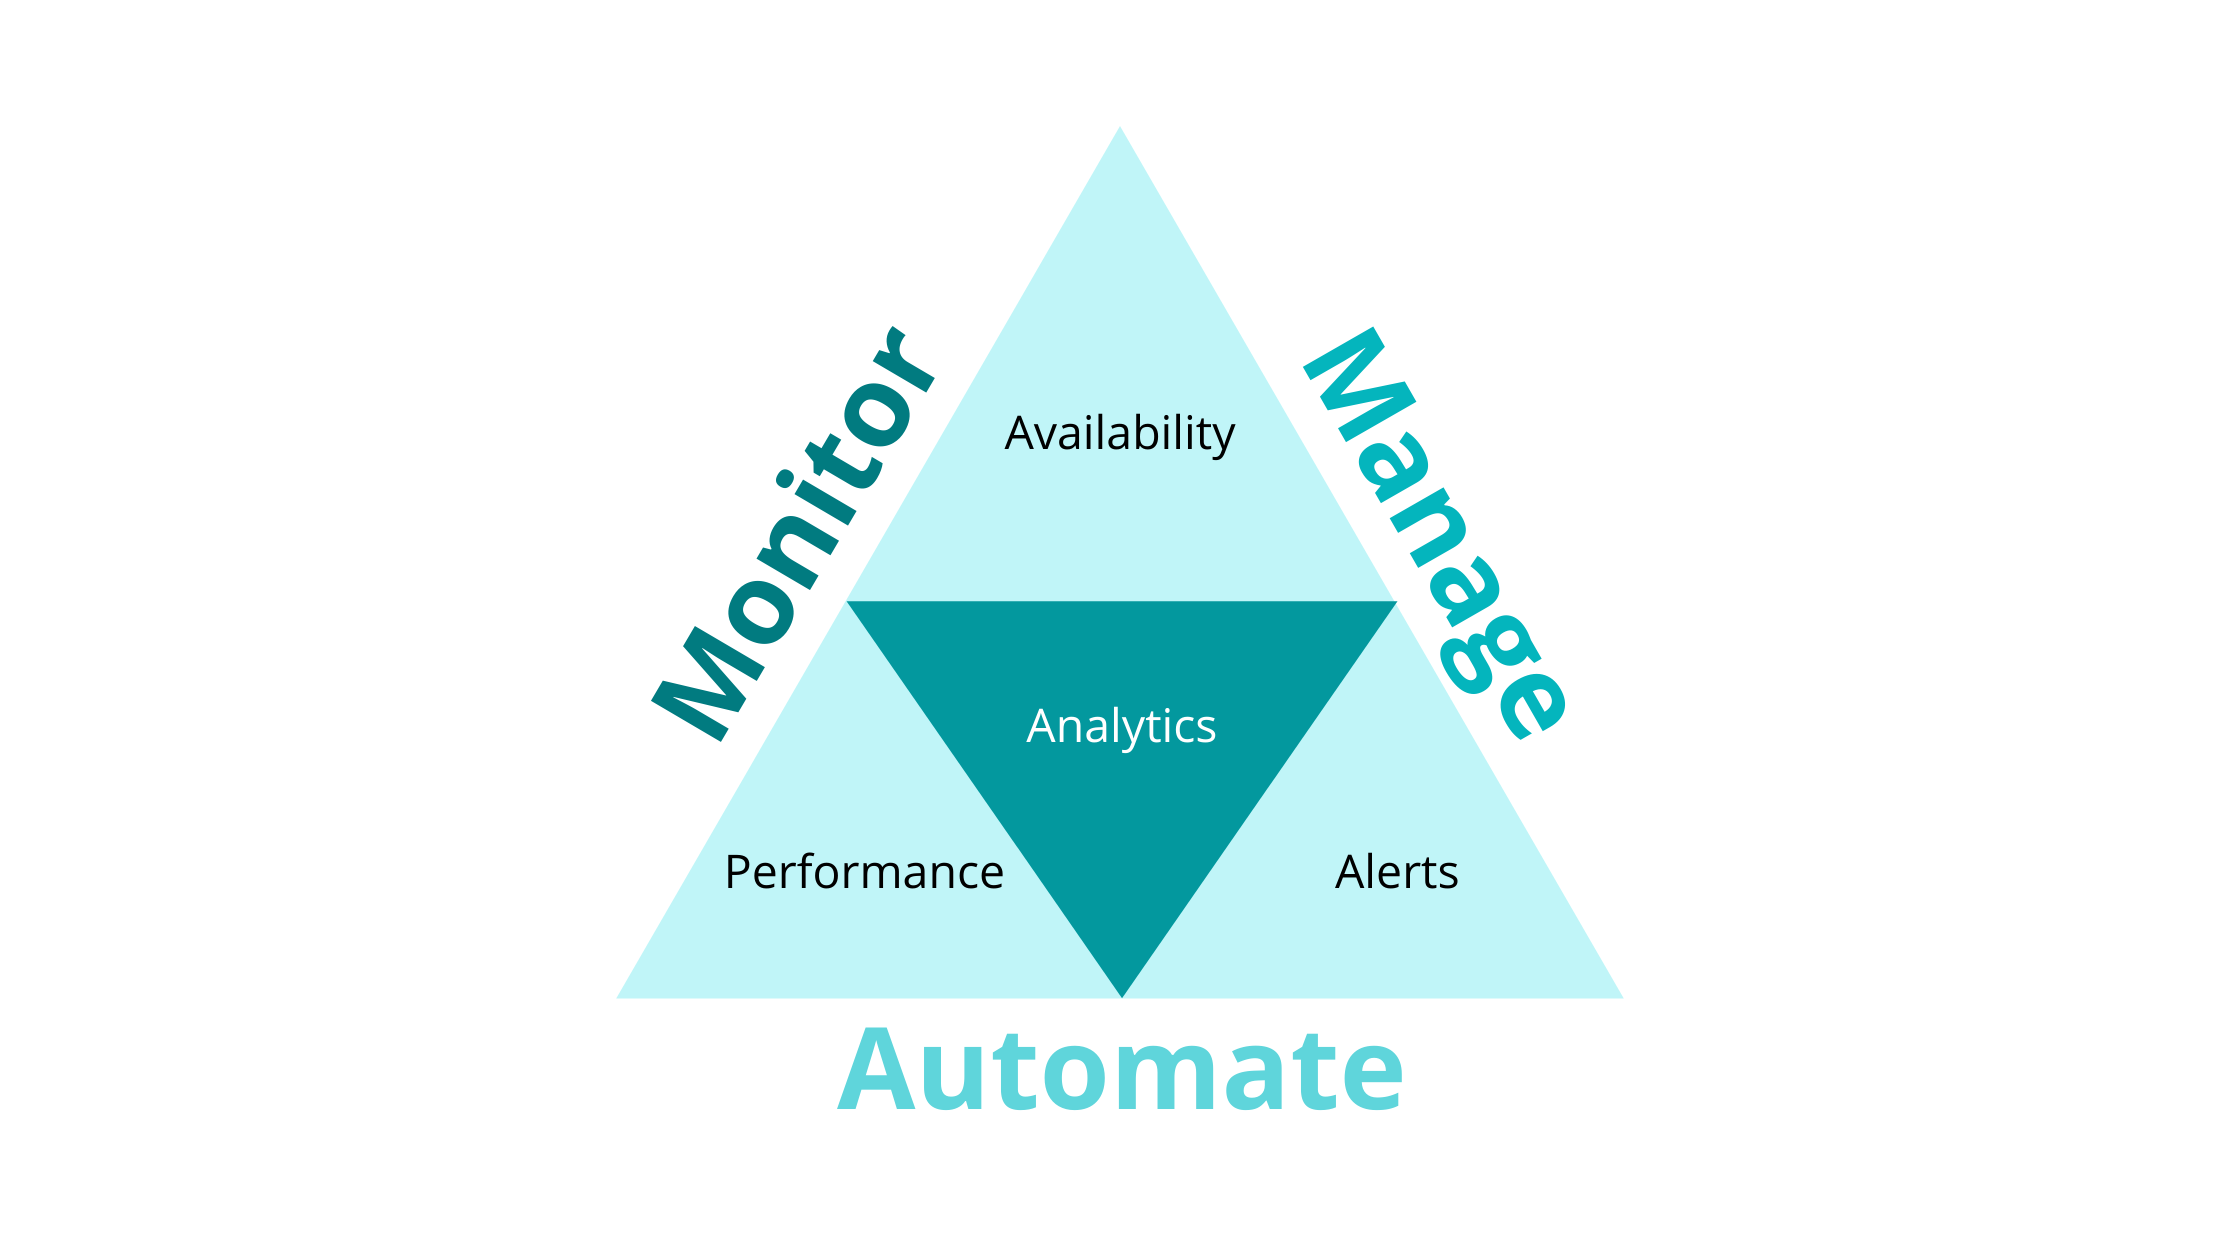
Figure 1: Service Health Monitoring Concept
...
Availability Monitoring is determining whether an application, a particular service, or an infrastructure component is up and running. It is the most important and fundamental requirement when monitoring systems and applications. However, availability monitoring is not useful without the service context and its relationship to Service Level Objectives (SLO). SLO defines what the availability should be (i.e. what percentage over time) and how it should be measured.
...
For example, SAP ERP, an SAP application, may have uninterrupted availability for end-users but one or more of its underlying infrastructure components such as application servers, message server, enqueue server, and database servers can be down at any given time. How is this possible? Aren't all of these infrastructure components required to be running before you can say that the service is functional? To answer that, environments should have high-availability (HA) configured to make this possible. With HA configuration, infrastructure components will have redundancies to ensure all the single points of failure are covered. This is where the monitoring complexities emerge. With service health monitoring, these requirements can be properly distinguished and managed accordingly.
IT-Conductor™ can monitor the availability of user-defined services and the supporting infrastructure components with more flexibility. Using the platform's parallel processing engine, service availability monitoring would be simplified through depicting a correlation of the individual components of the operating system in such a way that you can easily see at a glance if a service is available or not, in relation to the other dependent components as well.
Performance Monitoring
Monitoring performance follows the same tier concept where you need to look at all the layers to ensure that the service is good in terms of its performance. Taking a deep-dive into performance monitoring, let's take a look at the image below. In these tiers—services, applications, and infrastructure—you could see that performance is just one of the surrounding pillars. This signifies that service performance monitoring or management extends its definition to the overall state of an environment.
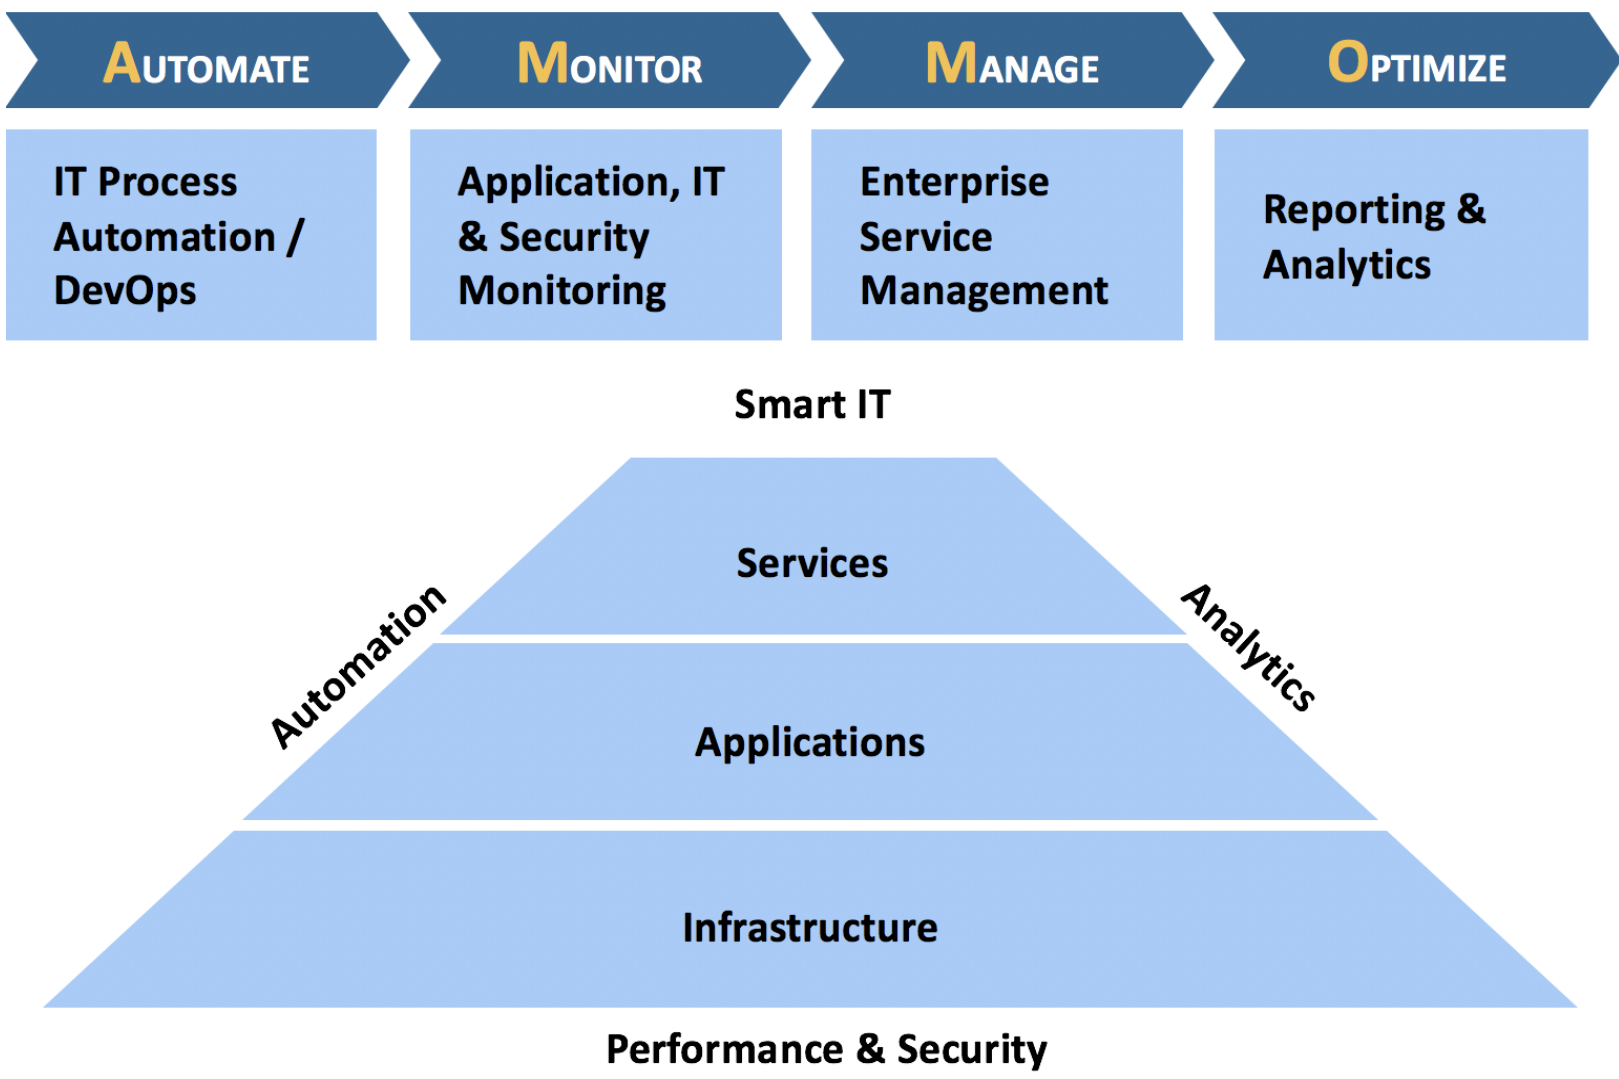
Figure 4: Service Performance Management
In the context of monitoring performance in SAP systems, IT-Conductor™ helps enhance performance management in the following areas:
- End-user experience services can track specific sets of key performance indicators for a custom set of metrics, such as user, transactions, locations, dialog vs HTTP, etc.
- Service discovery of application-aware components and relationships
- Composite services assembled from other services and monitors
- Easily configure target availability, response times, and notification if the goals are not met
- Drill down into services to discover the root-cause
Performance Monitoring also involves the measurement of performance against a customized set of key performance indicators (KPIs) over a period of time. This requires synchronized data series. However, response time is a misleading indicator of performance. To put it into perspective, a system may have 0.5 second response time, but there may still be constant complaints from users with bad response times. The better way would be to create groups of transactions, by any combination of these attributes such as TCODE, USER, TASK TYPE, APP SERVER, USER TERMINAL, etc. They may represent business processes, such as Sales-Order-to-Cash, and service level objectives maybe set up for average response times across Orders (VA01, VA02, VA03), Delivery (VL01N, VL02N, VL03N), Shipping (VT01N, VT02N, VT03N) and Billing (VF01, VF02, VF03). Then aggregate their KPIs where the default would still be dialog response time, but it could be database response time, network GUI time, etc. and monitor, manage them automatically against service level objectives, and trigger actions based on policy-based exceptions such as alerts and notifications. All that along with other application, database and system metrics as well as events so that correlation can be used if needed during performance analysis.
There's a multitude of data to analyze. It would be difficult to diagnose when issues occur. In the context of troubleshooting, correlation plays a huge part in finding out the root cause of the problem.
IT-Conductor™ makes it easier for you to associate these information through the expandable service grid levels
<screenshot to be updated
...
Alerting
...
; similar to page 14 of ITC White Paper>
Alerts
IT-Conductor™ manages alerts using policy-based exceptions where alerts can be filtered, time-synchronized and automatically recovered, including targeted notification to the right analyst reducing mean time to repair (MTTR).
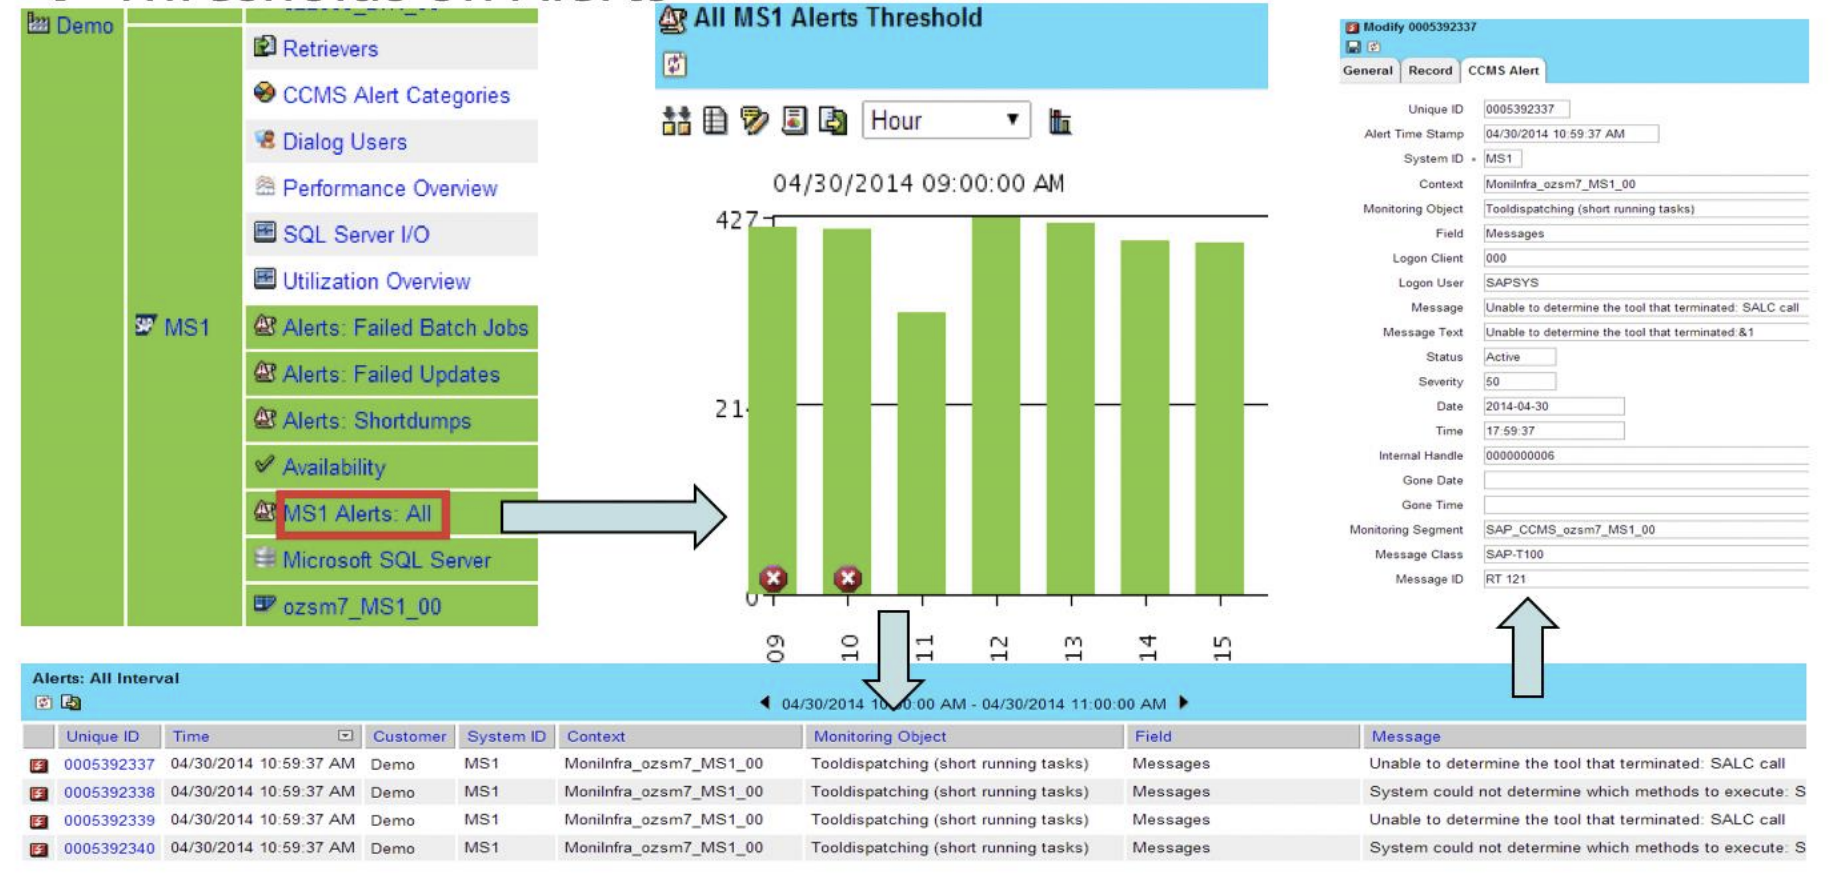
Figure 5: Alert Management in IT-Conductor™
More Information
- Learn more about the concept behind ITC monitoring here.
- Learn how to create threshold overrides.
Analytics
To be updated
Step-by-step guide
...
| Widget Connector | ||
|---|---|---|
|
...
Related articles
| Filter by label (Content by label) | ||||||||||||||||||
|---|---|---|---|---|---|---|---|---|---|---|---|---|---|---|---|---|---|---|
|
...
| Page Properties | ||
|---|---|---|
| ||
|
...
Do you have a question about the content on this page? E-mail us at support@itconductor.com.