IT-Conductor monitors the performance and availability of SAP ASE such as servers, thread pools, devices, and database alerts.
...
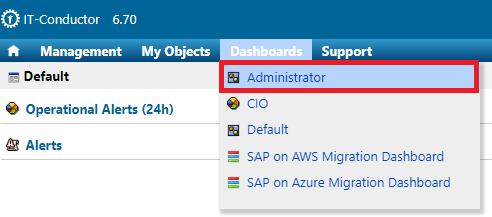
1.) In the IT-Conductor main dashboard, navigate to Dashboards > Administrator.
2.) In the Administrator Dashboard, locate the ASE Servers panel and click "+" icon to start adding a system to be monitored.
...
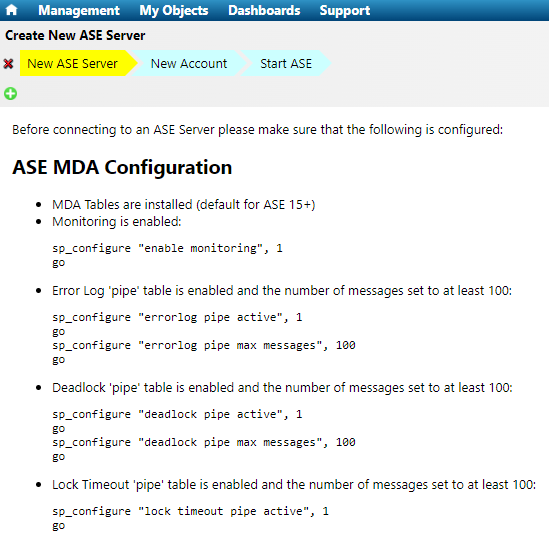
3.) Before connecting to an ASE Server, please make sure that the following configuration parameters are properly configured.
4.) In the Create New ASE Server wizard, fill out all the necessary information. Once completed, click the "+" icon button to add the system.
...
5.) A pop-up message will appear to confirm that the SAP ASE has been added successfully. Click "OK" to dismiss and proceed to configure the ASE Server user to be used for monitoring.
...
6.) Provide the new SAP Account information in the wizard and press Finish to click "Finish" to complete the configuration.
...
7.) A pop-up message will appear to confirm that the JDBC DB account has been created successfully. Click "OK" to complete the process.
...
8.) You should now be able to see the newly added ASE Server under the ASE Servers panel with the status "In Progress".

| Info | ||
|---|---|---|
| ||
It may take a couple of minutes to show "In Progress". You may refresh the page if it does not appear after 5-15 minutes (depending on how many application servers exist). If there are issues with the configuration such as wrong system connection parameters or invalid account, you may see the status as "Ready" which indicates that the system is not running. For further troubleshooting, click on the Log icon in the Tools next to the ASE servers. |
...
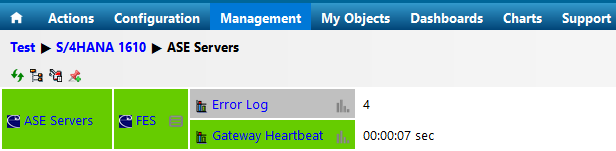
9.) Once the status is set to "Ready", you should see the ASE Server in the Service Grid service grid similar to what is shown below.
...
Do you have a question about the content on this page? E-mail us at support@itconductor.com.
.