Background
Monitoring service health is beyond the standard system monitoring which only focuses on monitoring availability, utilization, and other basic metrics most system administrators attend to on their day-to-day work. Service Health Monitoring involves managing the overall health of a service or an application and all of its underlying infrastructure components.
...
Service health is a combination of Availability, Performance, Alerts, and Analytics. It indicates whether a service is healthy or not. But what does healthy really mean in the context of service health monitoring? Can a service be considered healthy if it is available yet the performance is bad? How about if the performance is good, does that equate to service being healthy? Or maybe, alerts are flooding in but the service is available and performing well, what does that indicate? The truth is—not one factor indicates whether a service is healthy or not. When monitoring service health, you need to look at the perspective from a 360° view.
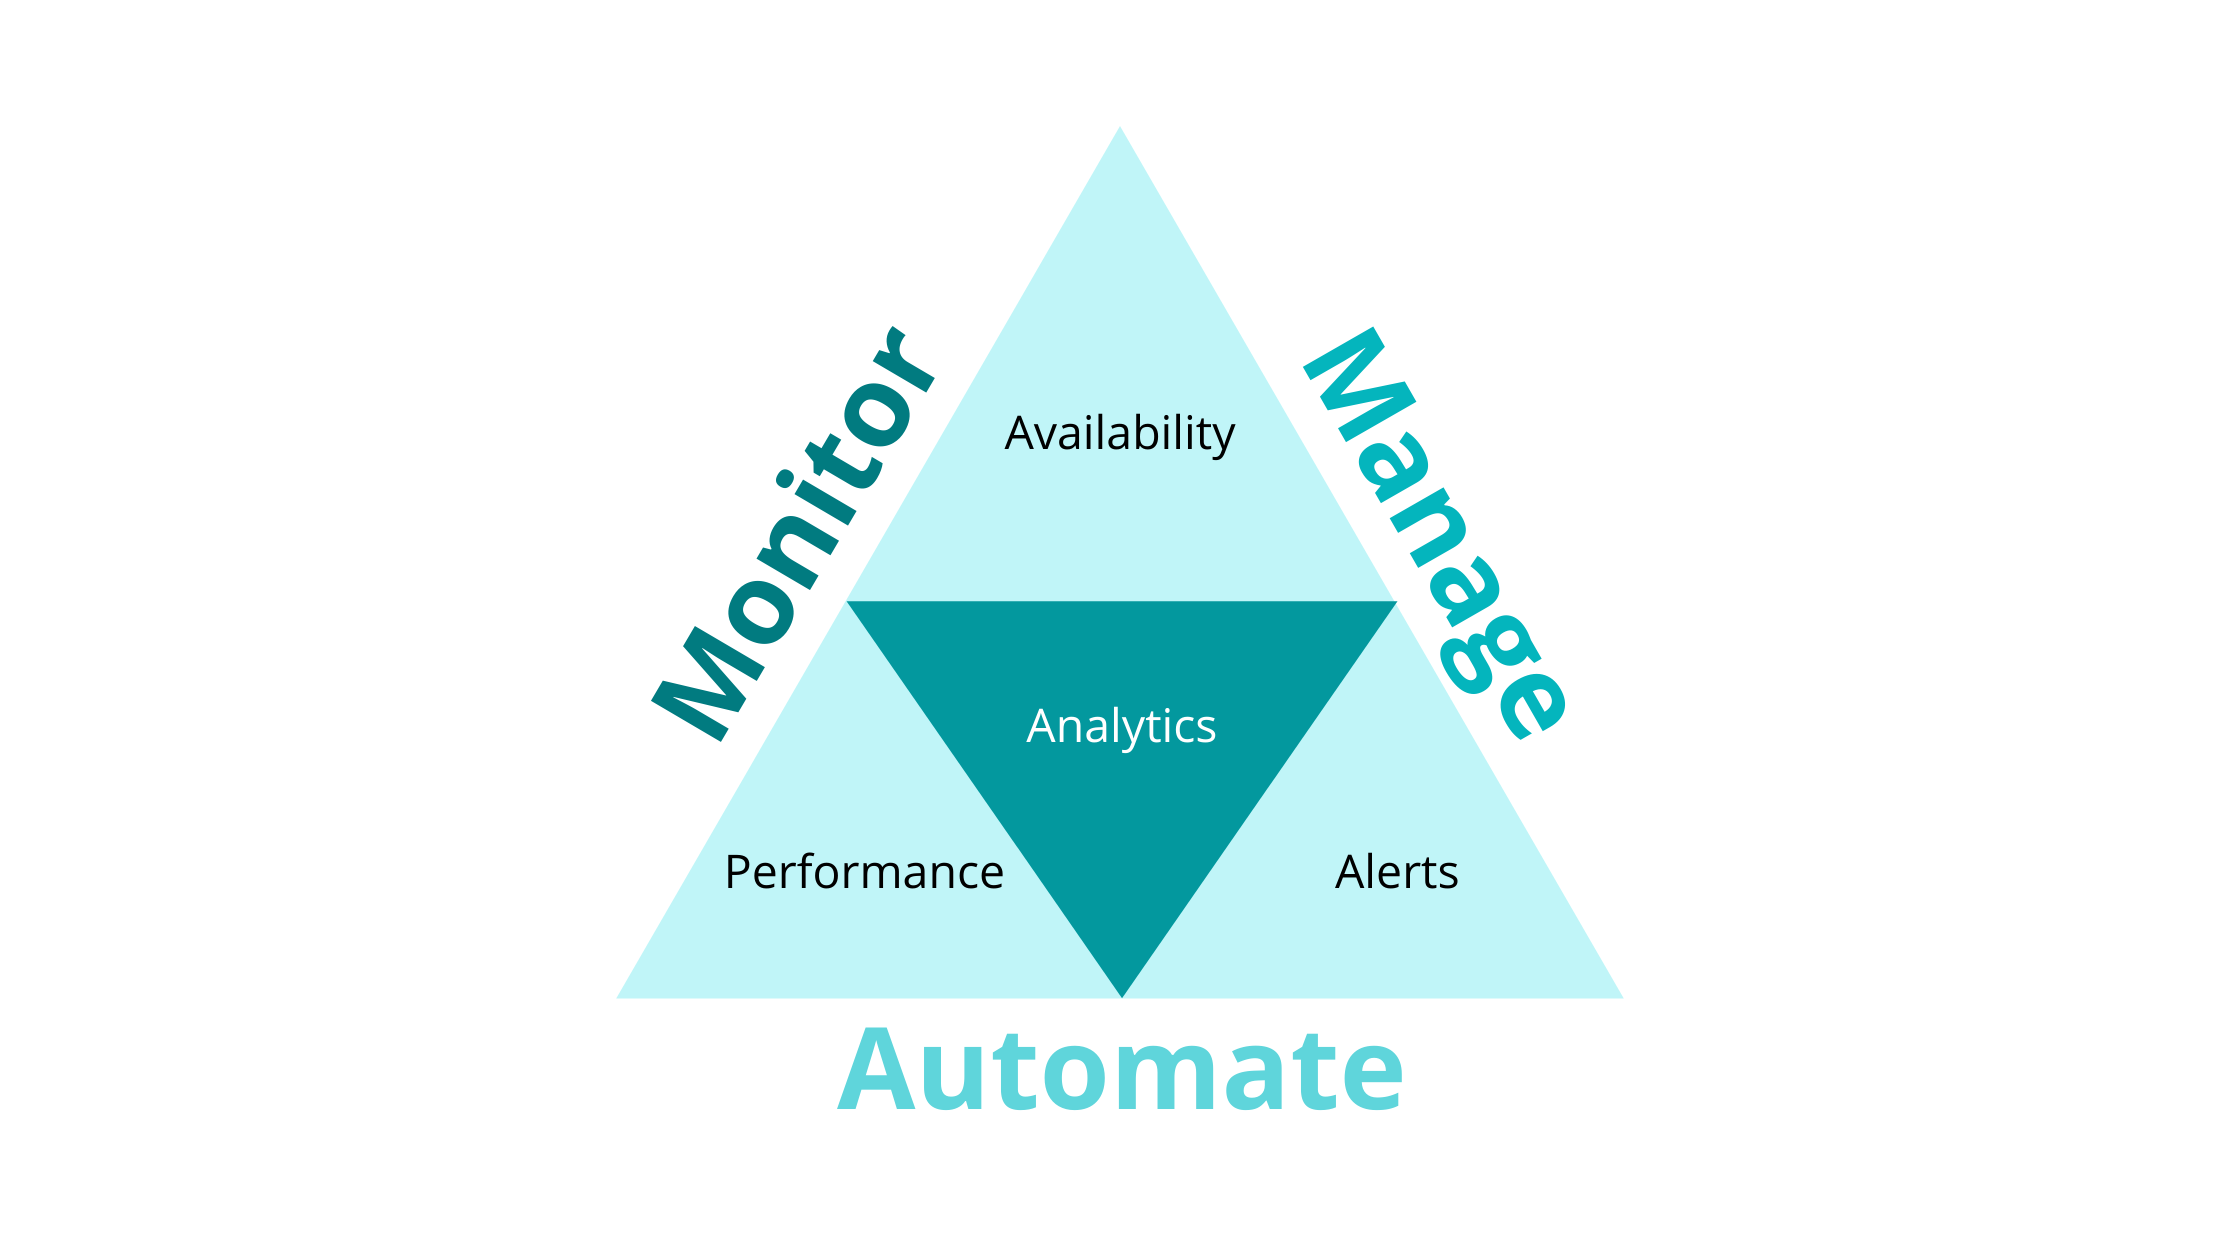
Figure 1: Service Health Monitoring Concept
...
Figure 2: Sample Availability Monitoring Chart in IT-Conductor™
Availability of services can be very different from component availability. In the context of monitoring SAP, you must understand that application is just a portion of the entire system landscape.
...
Following the three-tier architecture, you can conclude that monitoring SAP system landscapes involve monitoring the presentation, application, and the database layers. On the other hand, monitoring component availability only involves keeping an eye on a specific component, independent from the other components within the enterprise infrastructure. This clearly signifies that monitoring service availability is more in-depth than monitoring component availability, which means it is more complex too.
...
IT-Conductor™ can monitor the availability of user-defined services and the supporting infrastructure components with more flexibility. Using the platform's parallel processing engine, service availability monitoring would be simplified through by depicting a correlation of the individual components of the operating system in such a way that you can easily see at a glance if a service is available or not, in relation to the other dependent components as well.
...
Monitoring performance follows the same tier concept where you need to look at all the layers to ensure that the service is good in terms of its performance. Taking a deep - dive into performance monitoring, let's take a look at the image below. In these tiers—services, applications, and infrastructure—you could see that performance is just one of the surrounding pillars. This signifies that service performance monitoring or management extends its definition to the overall state of an environment.
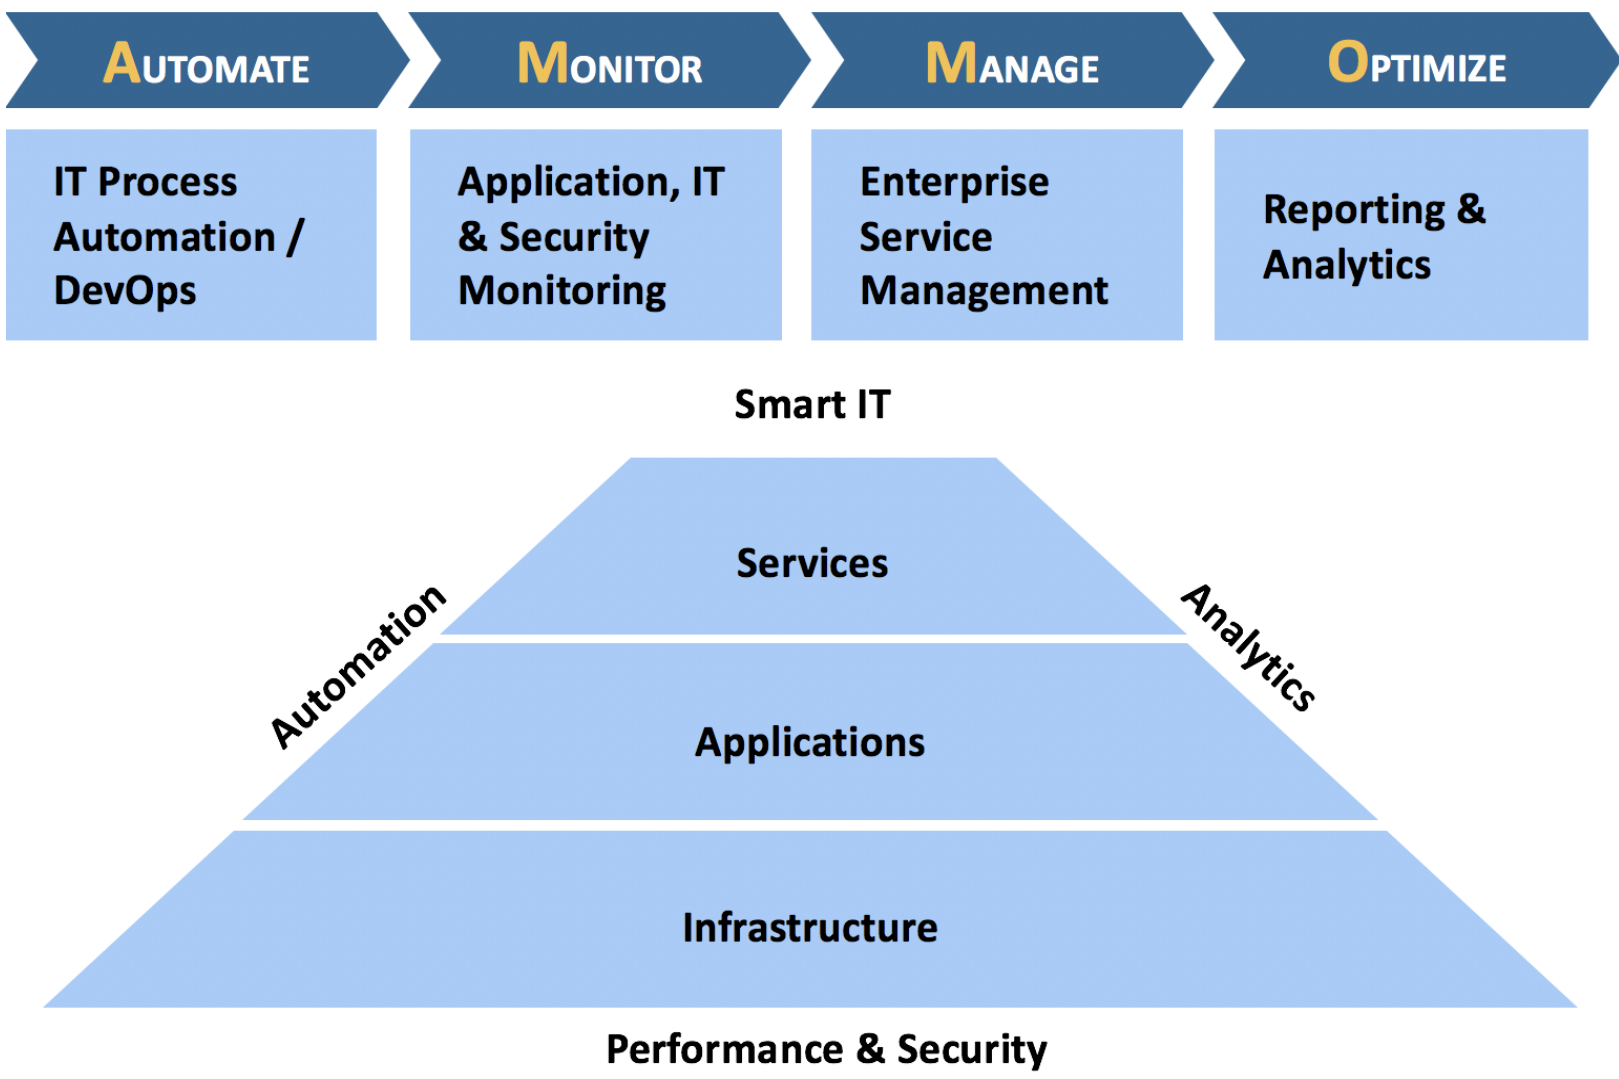
Figure 4: Service Performance Management
In the context of monitoring performance in SAP systems, IT-Conductor™ helps enhance performance management in the following areas:
...
Performance Monitoring also involves the measurement of performance against a customized set of key performance indicators (KPIs) over a period of time. This requires synchronized data series. However, response time is a misleading indicator of performance. To put it into perspective, a system may have 0.5 second response time, but there may still be constant complaints from users with bad response times.
The better way would be to create groups of transactions, by any combination of these attributes such as TCODE, USER, TASK TYPE, APP SERVER, USER TERMINAL, etc. They may represent business processes, such as Sales-Order-to-Cash, and service level objectives maybe may be set up for average response times across Orders orders (VA01, VA02, VA03), Delivery delivery (VL01N, VL02N, VL03N), Shipping shipping (VT01N, VT02N, VT03N), and Billing billing (VF01, VF02, VF03). Then aggregate their KPIs where the default would still be dialog response time , but it could be database response time, network GUI time, etc. Monitor and monitor, manage them automatically against service level objectives , and trigger actions based on policy-based exceptions such as alerts and notifications. All that along with other application, database, and system metrics as well as events so that correlation can be used if needed during performance analysis.
There's a multitude of data to analyze. It would be difficult to diagnose when issues occur. In the context of troubleshooting, correlation plays a huge part in finding out the root cause of the problem.
IT-Conductor™ makes it easier for you to associate these this information through the expandable service grid levels
...
levels.
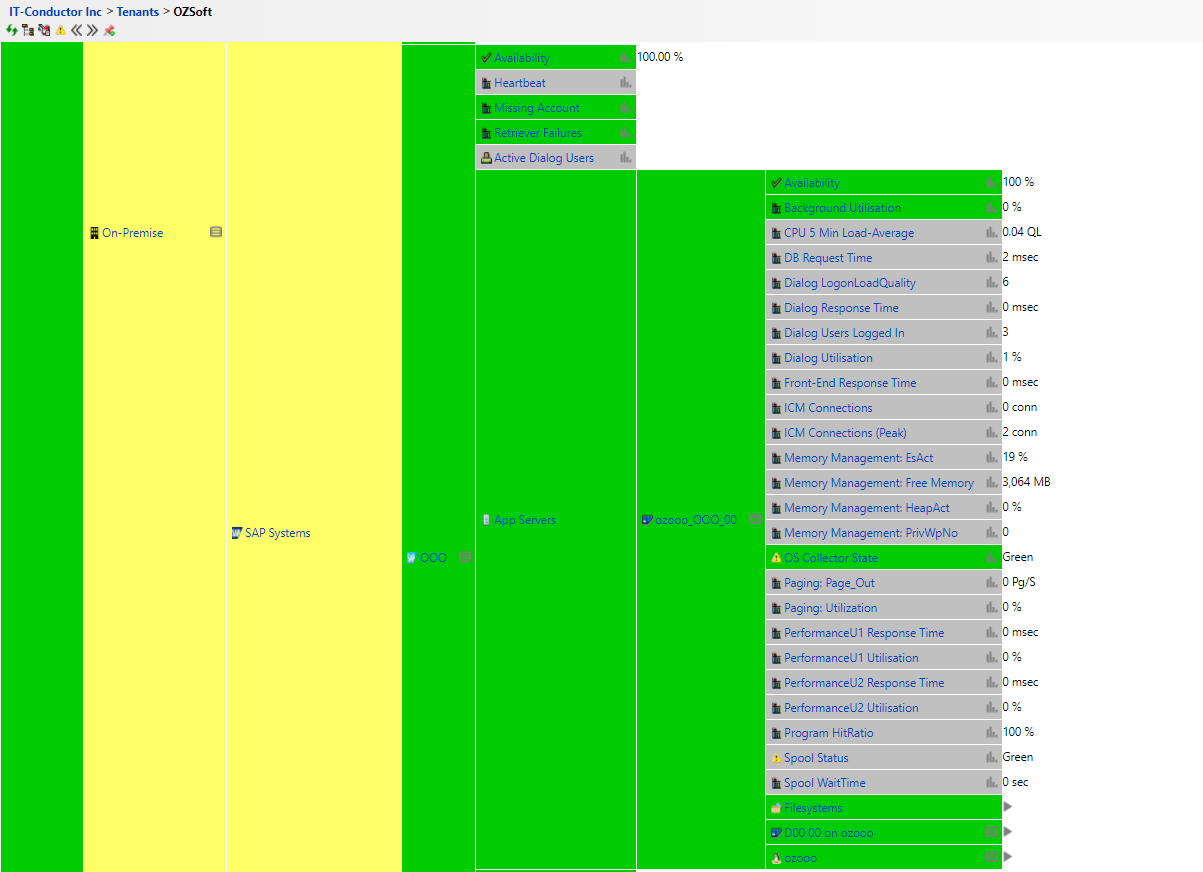 Figure 5: Expandable Service Grid Levels by Component
Alerts
IT-Conductor™ manages alerts using policy-based exceptions where alerts can be filtered, time-synchronized, and automatically recovered, including targeted notification to the right analyst reducing mean time to repair (MTTR).
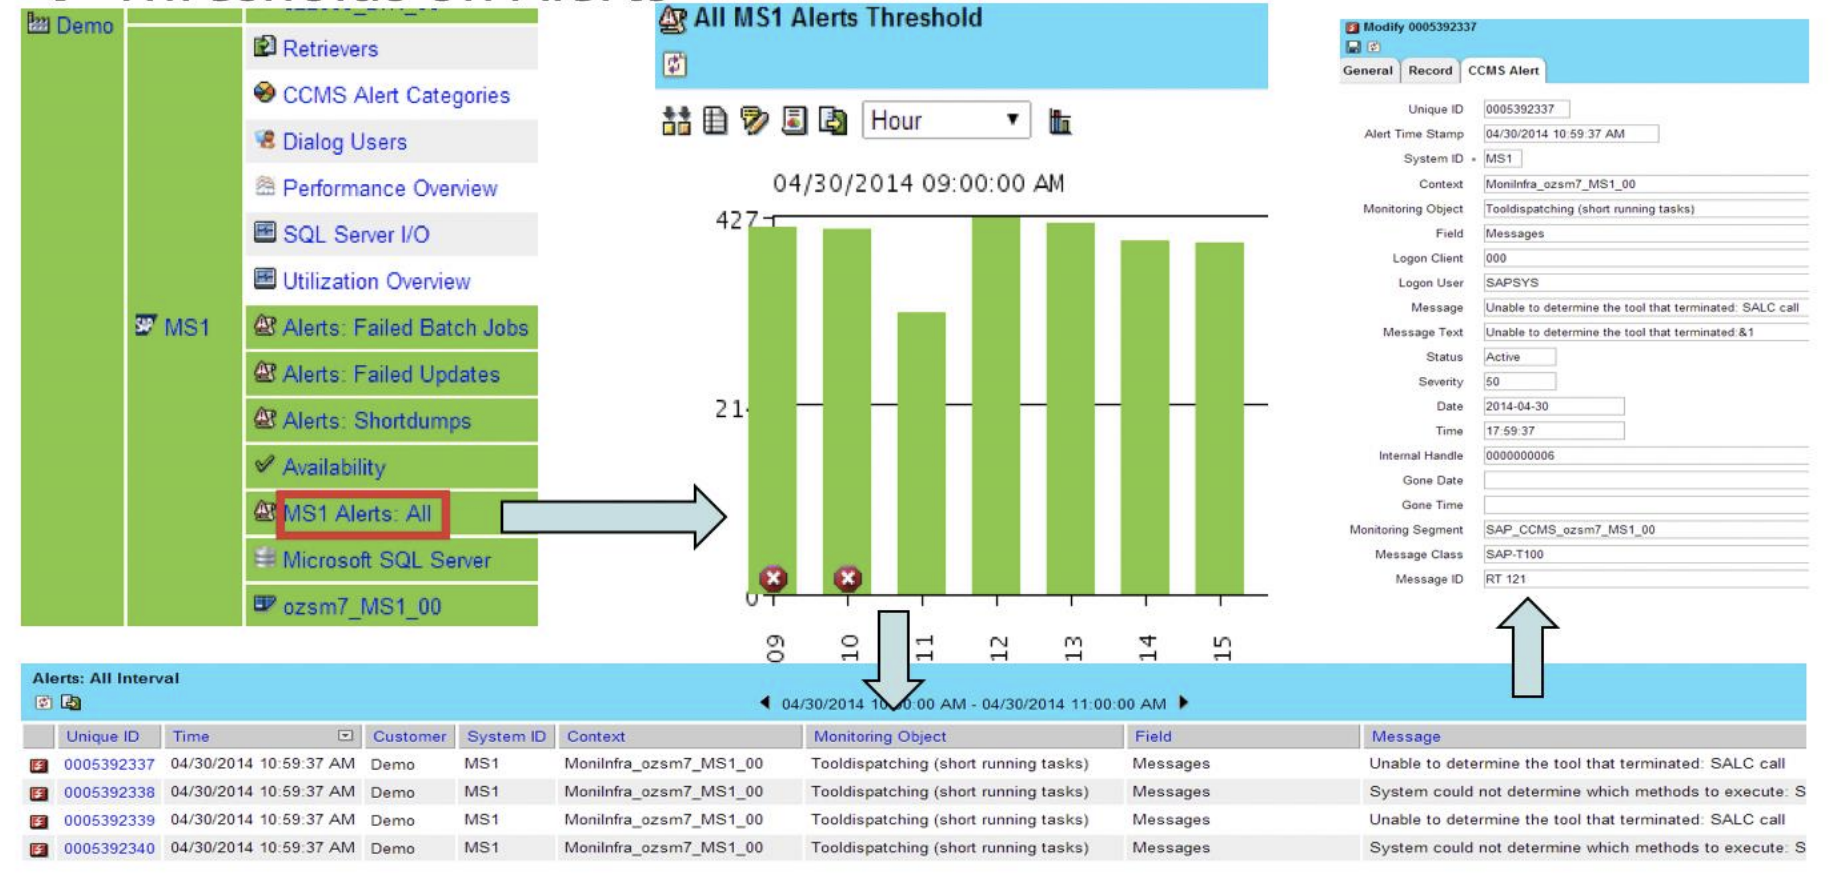
Figure 56: Alert Management in IT-Conductor™
More Information
- Learn more about the concept behind ITC monitoring here.
- Learn how to create threshold overrides.
Analytics
To be updated
Step-by-step guide
...
Alerts are configured in IT-Conductor™ using the concept of thresholds and overrides. Upon completing the setup of the ITC gateway and the required configurations for the monitored systems, the platform will start receiving different metrics. Using thresholds and overrides, ITC can send out alert notifications via e-mail provided that the user has subscribed to receive notifications for that particular service.
For more information, you may read:
Analytics
With all the available information that the platform is receiving from the monitored systems, we have designed and built IT-Conductor™ to display real-time metrics in the service grid.
In the sample service grid below, you could see how the service grid can be expanded up to the most granular component in your system landscape. This makes troubleshooting hassle-free since you don't need to log-in and out systems and issue scripts or commands just to get the information (metric) that you need.
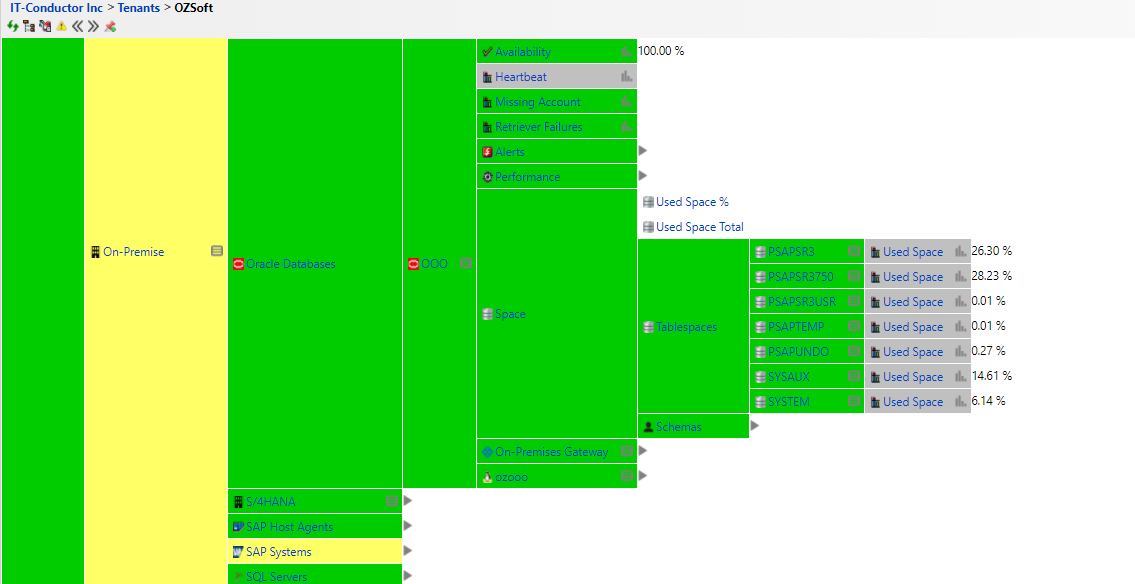 Figure 7: Sample Real-time Tablespaces Utilization
Moreover, you can preview the historical chart when you click directly from the service grid.
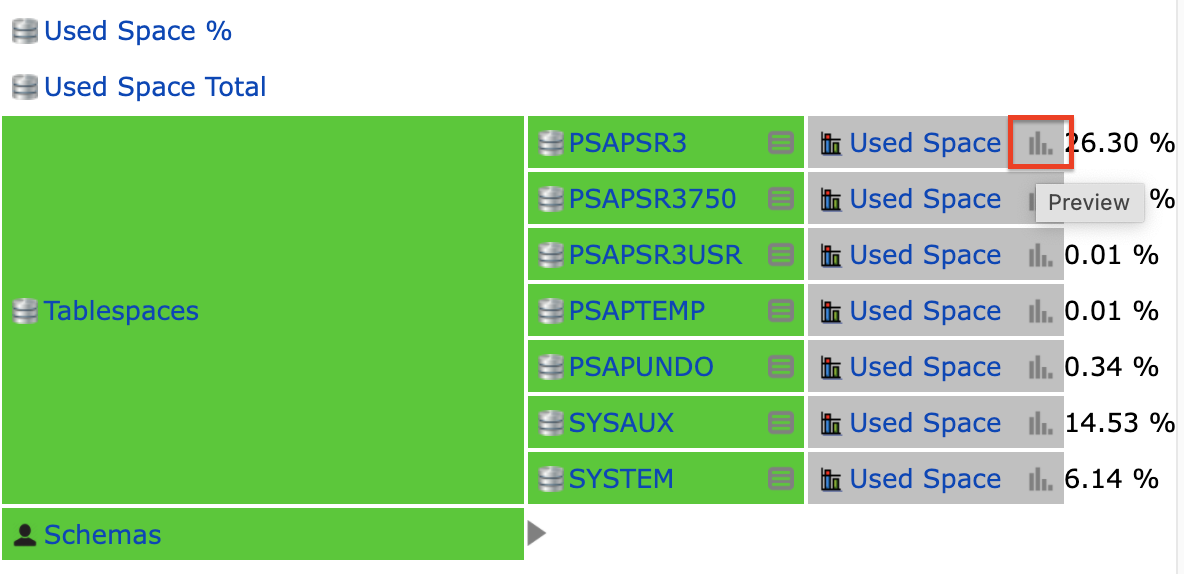
Figure 8: Preview Historical Chart from Service Grid
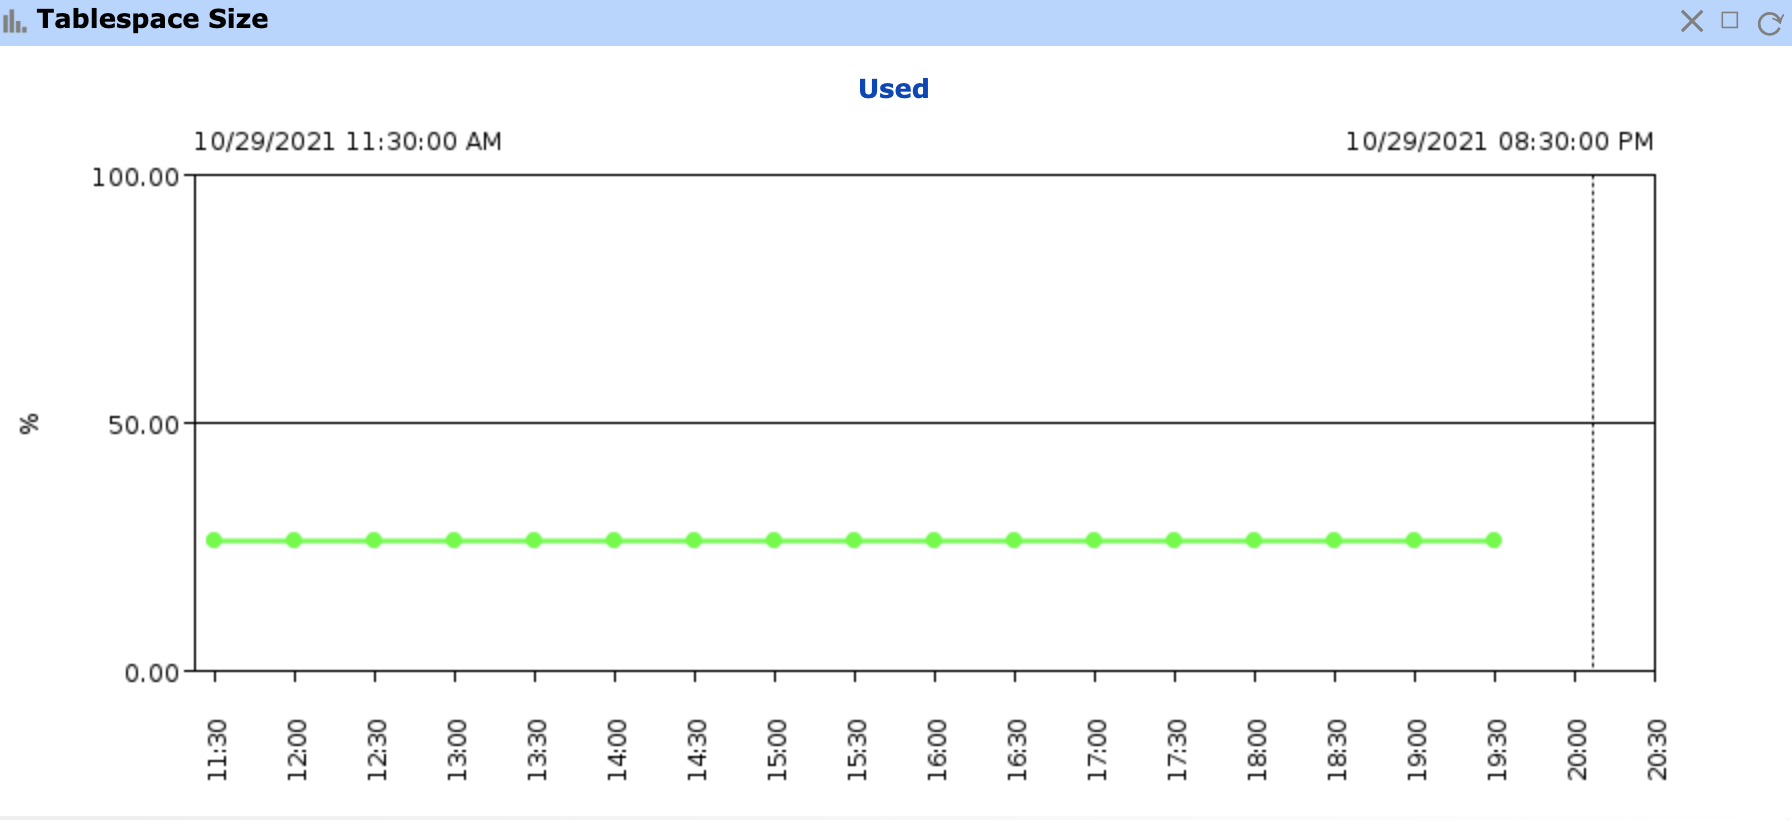
Figure 9: Sample Historical Chart (Tablespace Size)
These charts can be customized depending on how the user wants to consume the information.
Here are some of the reports that you can generate on the platform:
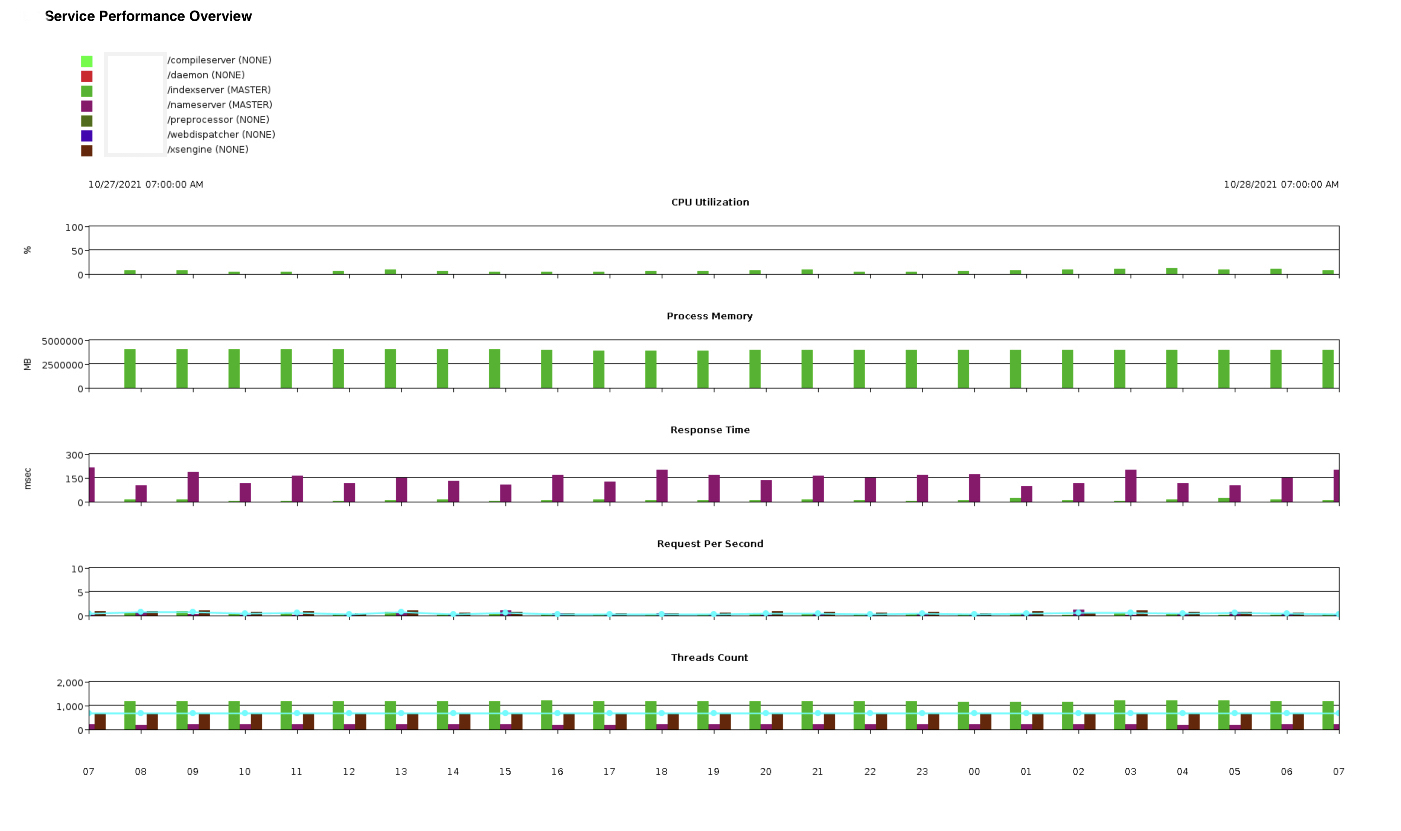
Figure 10: Service Performance Overview
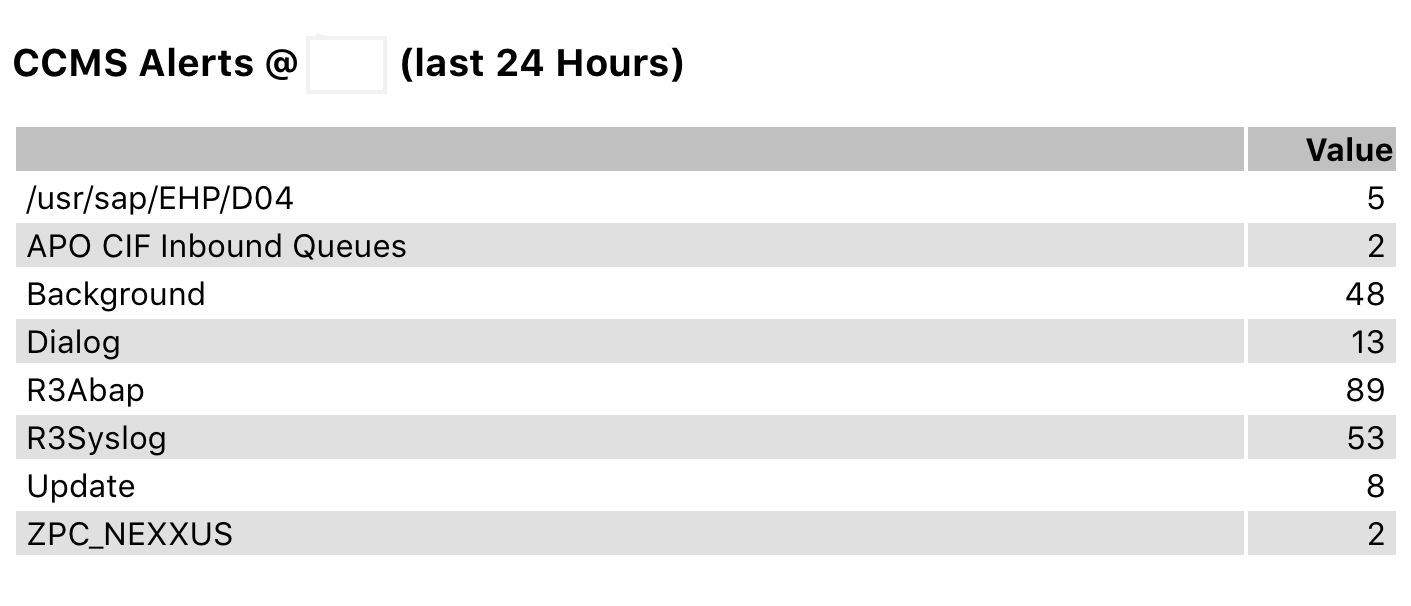
Figure 11: CCMS Alerts
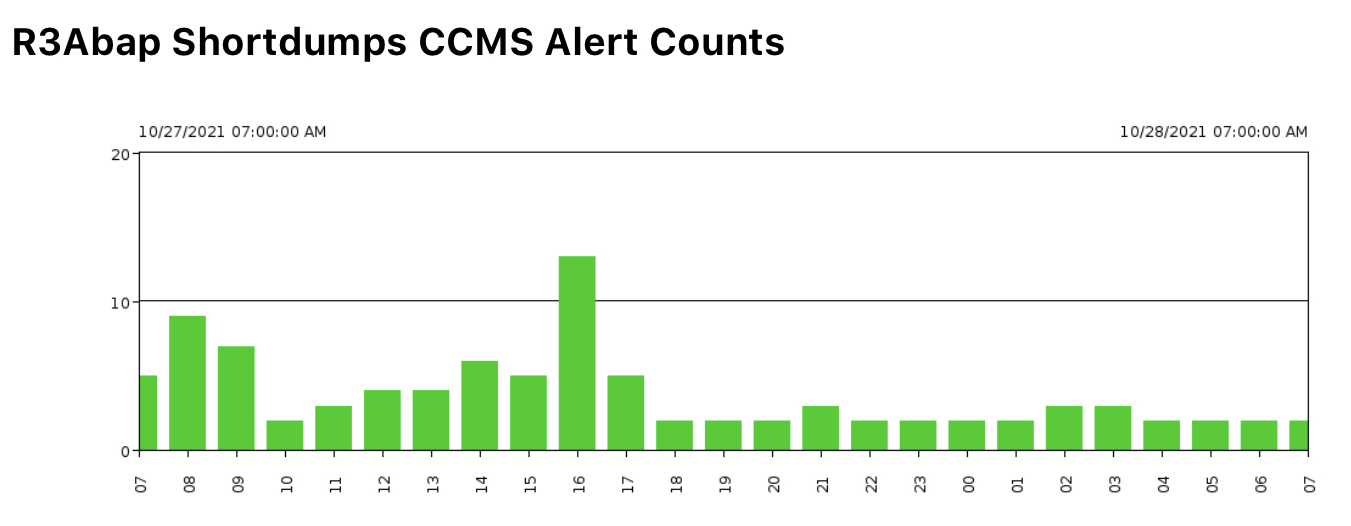
Figure 12: Shortdumps CCMS Alert Counts
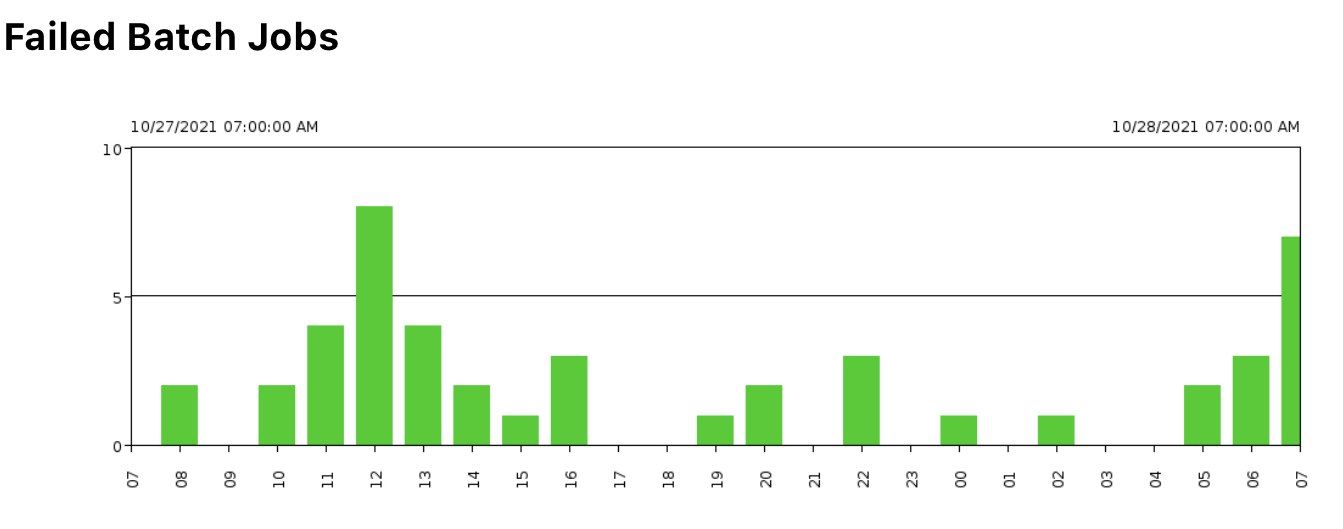
Figure 13: Failed Batch Jobs
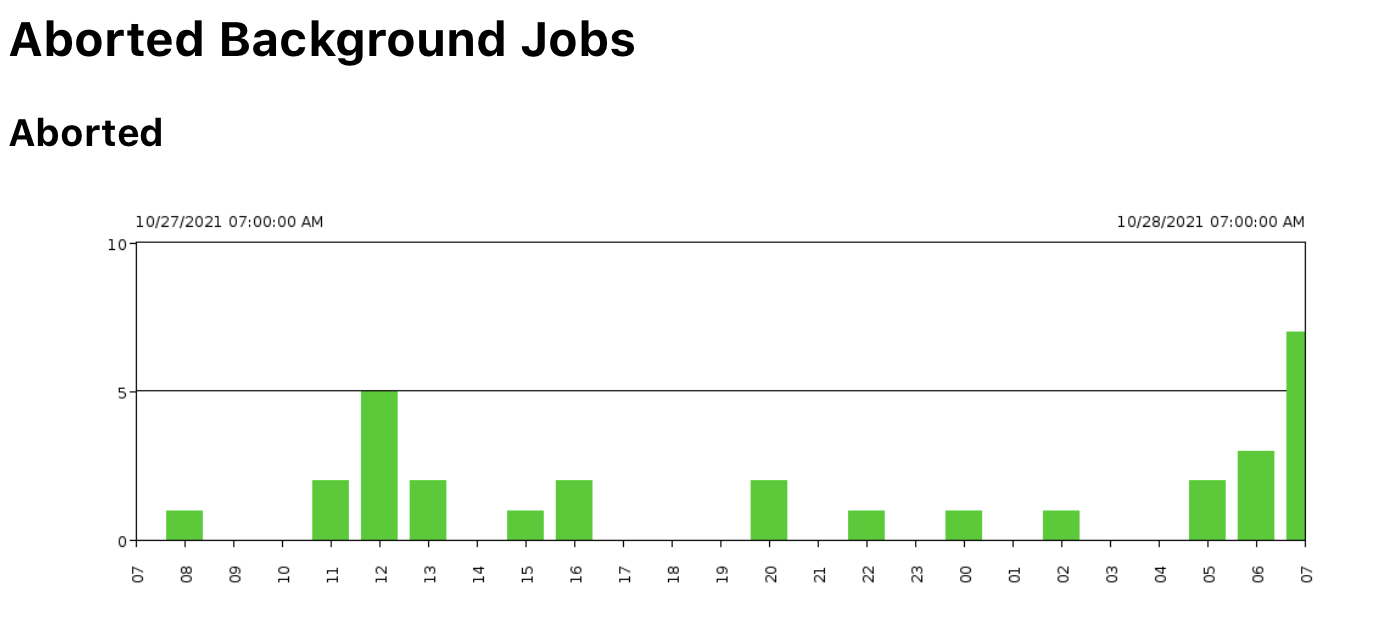
Figure 14: Aborted Background Jobs
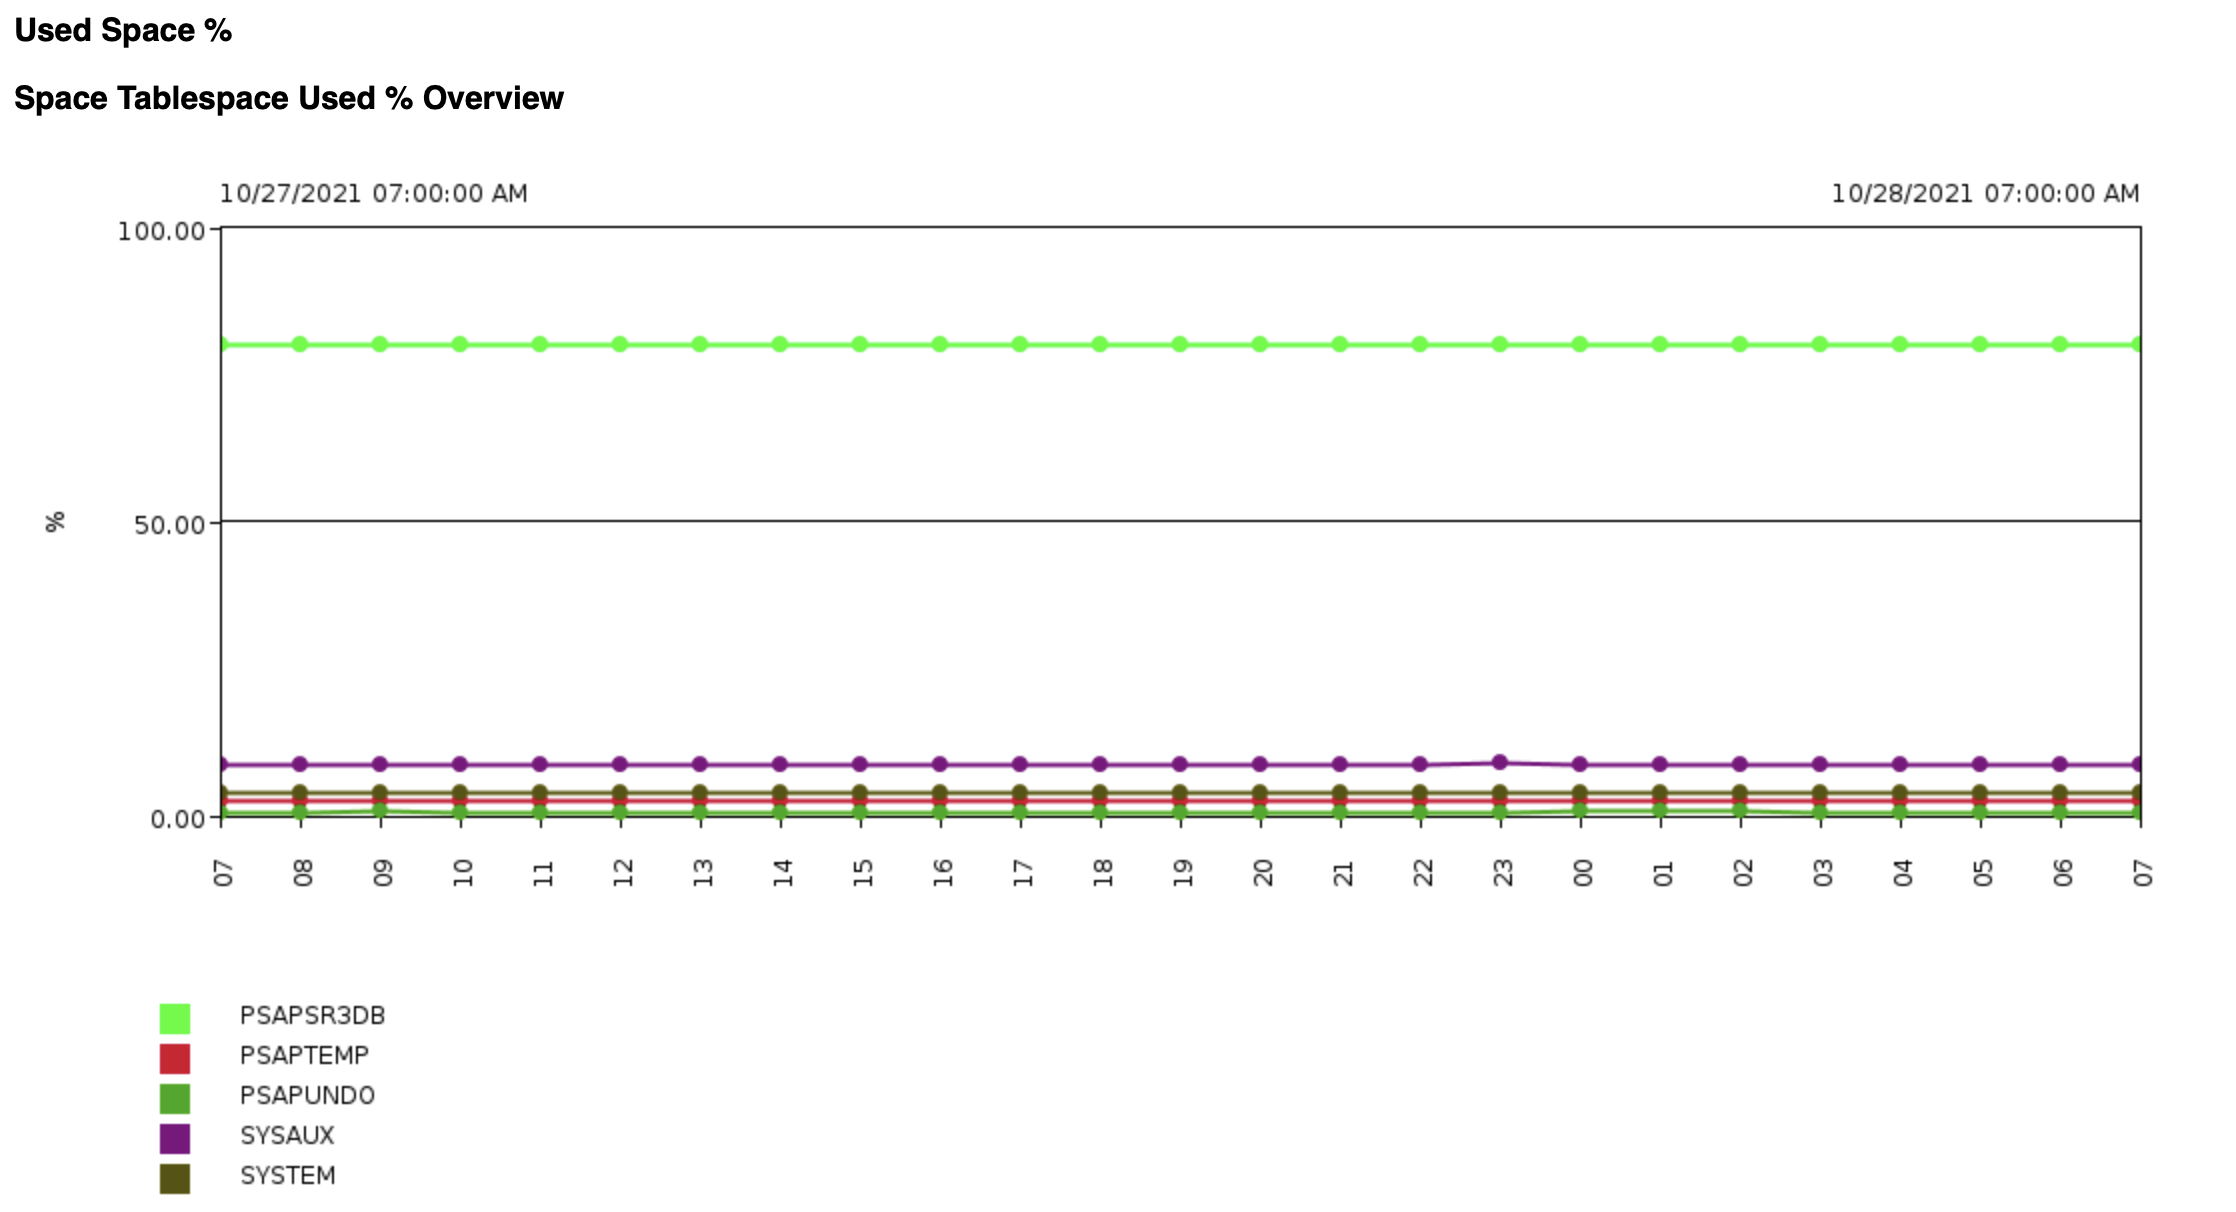 Figure 15: Used % Overview
Video
| Widget Connector | ||
|---|---|---|
|
Related
...
Articles
| Filter by label (Content by label) | ||||||||||||||||||
|---|---|---|---|---|---|---|---|---|---|---|---|---|---|---|---|---|---|---|
|
- Determining the Health of your SAP Environment
- SAP Basis System Health Check
- Monitor SAP KPIs Across Multiple Systems Simultaneously
- Application Performance Management for Microsoft SQL Server
| Page Properties | ||
|---|---|---|
| ||
|
...
Do you have a question about the content on this page? E-mail us at support@itconductor.com.