Background
...
Figure 2: Sample Pop-out Charts for Average Processing Time
Events and Performance
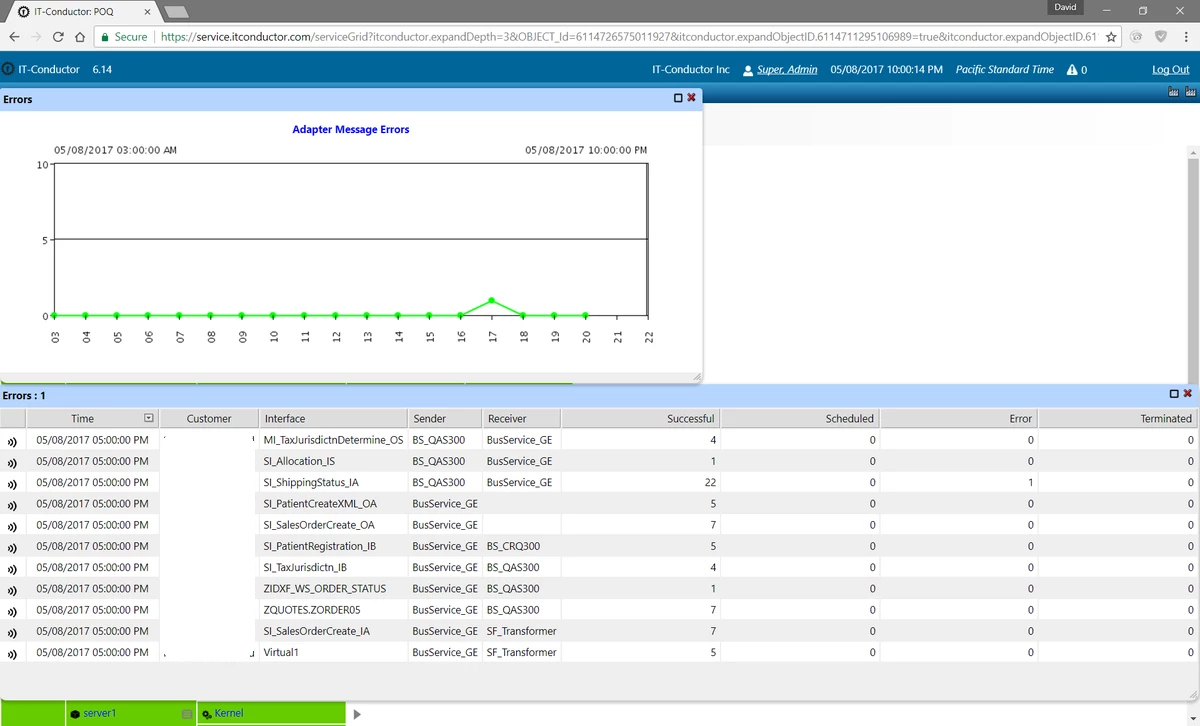
Historical and interval-based collectors allow you to drill down into the errors and have the whole context at your fingertips. This allows you to perform analysis from a single console.
Figure 3: Sample Historical and Interval-based View of Error Messages
...
IT-Conductor™ supplies the ITCONDUCTOR_MONITORING role that can be imported and assigned to the monitoring user.
- Learn more about Keystore Views and Certificates Monitoring.
...
Do you have a question about the content on this page? E-mail us at sidrefresh@itconductorsupport@itconductor.com.
